Ground UP Solutions

Still Relying on End-Of-Month Reports?

By the time your month-end report arrives, the margin has already gone. We give construction leaders weekly visibility while there’s still time to act

Male construction worker in orange high-visibility vest

Service

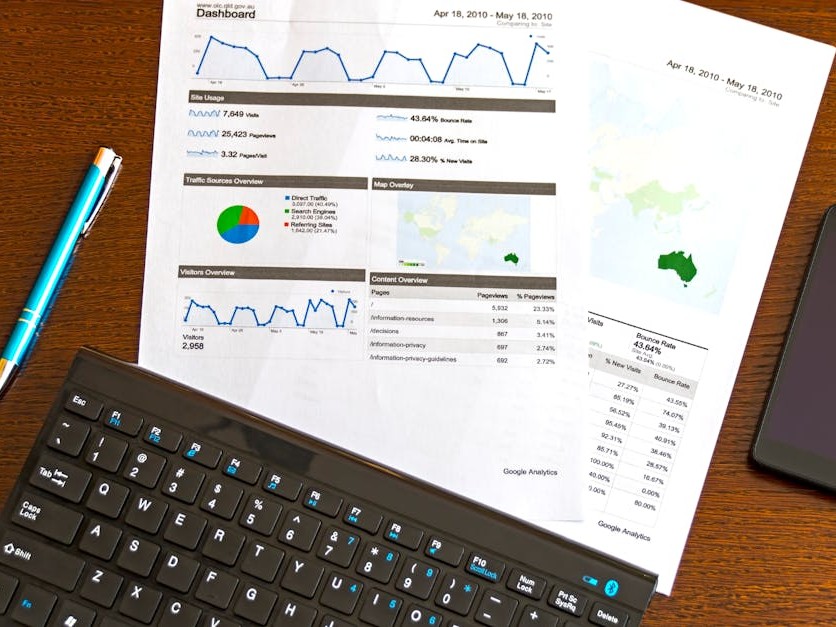
Live Financial, Safety & Quality Dashboards

Ground Up Solutions builds live dashboards that connect your existing systems and reveal the true financial position of every project (live).

With cost-to-date, cashflow exposure, margin performance, and safety and quality indicators available weekly — not monthly, leadership teams gain early visibility and stronger control across active projects.

Work desk with financial charts
Workspace with financial charts overview
Team analyzing charts and strategy

Real-Time Financial Visibility

Real-time visibility removes uncertainty from financial decision-making.

Live dashboards show how costs, revenue, cashflow, and margins are tracking as work progresses — not weeks later through static spreadsheets.

This allows leaders to respond faster, control spending earlier, and make informed decisions while projects are still active.

Live Reporting

Power BI Dashboards

Power BI dashboards bring Financial, Safety, Schedule and Quality data into a single, live view.

Designed specifically for construction teams, dashboards reflect how jobs are actually managed — not generic reporting templates.

Live updates ensure leaders see trends as they emerge, enabling quicker decisions and stronger control across projects.

Live Dashboards

Custom-built dashboards aligned to your projects, systems, and reporting structure.

Automated data connections reduce manual handling and reporting errors.

Clear, visual insights that support timely action at project and executive level.

Improved visibility over costs, margins, cashflow, and financial risk.

FREE CONSULTATION

Get a free 30 min clarity call

Tell us about your project and we will come with a ideal ideas


Prefer to call directly?

+61 438 944 396​

Live Reporting

Power BI Dashboards

Power BI dashboards bring Financial, Safety, Schedule and Quality data into a single, live view.

Designed specifically for construction teams, dashboards reflect how jobs are actually managed — not generic reporting templates.

Live updates ensure leaders see trends as they emerge, enabling quicker decisions and stronger control across projects.

Live Dashboards

Custom-built dashboards aligned to your projects, systems, and reporting structure.

Automated data connections reduce manual handling and reporting errors.

Clear, visual insights that support timely action at project and executive level.

Improved visibility over costs, margins, cashflow, and financial risk.

Financial Confidence

Engineers working together on blueprints

When numbers update in real time, choices happen quicker. Costs stay tighter because visibility improves. Trust grows as outcomes become clearer, step by step.

Financial transparency

Cash flow visibility

Custom dashboards

Live Tracking

Construction team reviewing project data

Frequently Asked Questions

arrow

What makes live financial reporting different from traditional reports?

Live reporting provides real-time insight, removing delays caused by manual updates and static spreadsheets.

Can dashboards be customised to our business?

Yes. Dashboards are tailored to your financial structure, project setup, and reporting requirements.

Do we need Power BI experience to use this service?

No. Dashboards are designed to be intuitive and easy for leadership and project teams to interpret.